
What gets exported
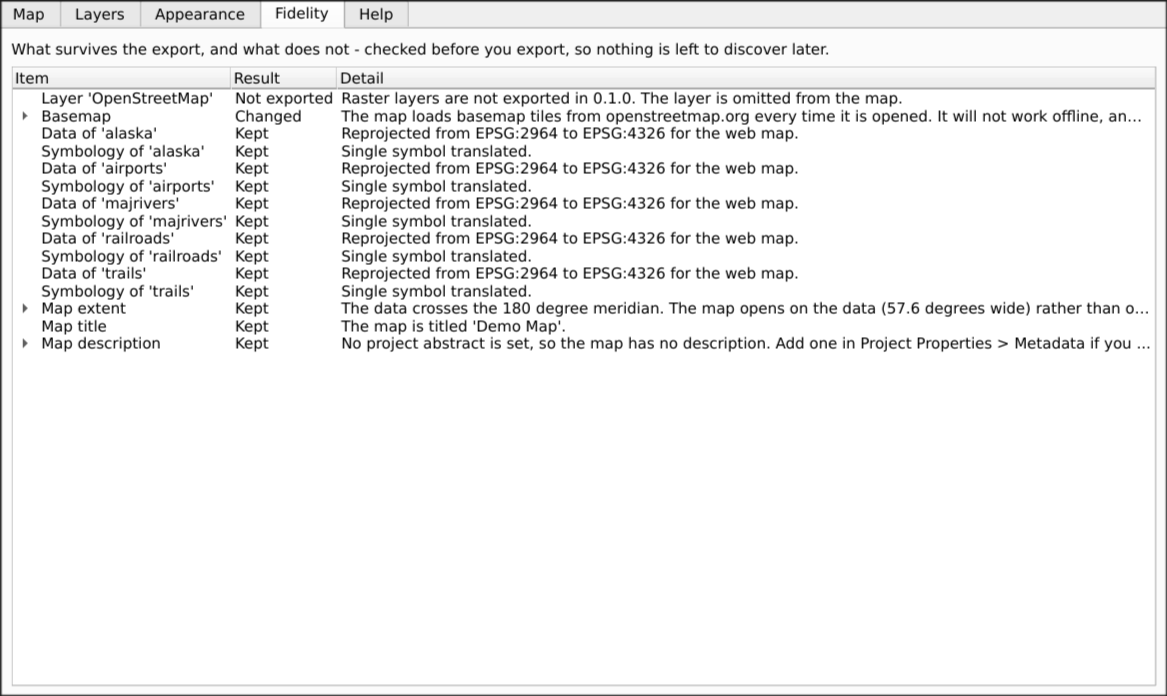
The plugin supports a deliberately narrow set, well, rather than everything, badly. Whatever is not translated exactly appears in the Fidelity tab - it is never dropped silently.
Where that line falls differently from the established plugin’s is set out in QGIS2WebMap or qgis2web.
Layers
| Vector points, lines, polygons | Yes |
| Layer order and groups, including nested groups | Yes |
| Layer visibility and opacity | Yes |
| Scale-dependent visibility | Yes - converted to the matching web zoom levels; the Fidelity tab shows the zooms, and how far they drift towards the edges of a tall map |
| Rasters from a file on disk (GeoTIFF) | Yes - inside a single HTML file up to 100 MB of imagery, or in Folder and Share ZIP. Colours are drawn in as QGIS shows them |
XYZ / WMTS tile layers ({z}/{x}/{y}) |
Yes - as live layers that need an internet connection. An address carrying an access key is refused rather than published |
| WMS, WCS and ArcGIS map services | Not exported - the web map cannot request images by extent. Use the service’s XYZ address if it has one |
| Attribute-only tables | Not exported - nothing to draw |
Data in any CRS is reprojected to WGS84 on the way out.
Size limits on the free plan
Exported maps are drawn by the OnlyMap runtime, and its free plan has three limits:
| Layers per map | 5 |
| Features per layer | 25,000 |
| Fetched data per map | 20 MB |
None of them applies to a map opened locally. The limits are for pages served
over http(s) from a real domain. Everywhere else the runtime lifts all three:
- a file opened from disk, or any address that is not
http/https localhost, anything ending.localhost, any127.xaddress,::1,0.0.0.0
So a Standalone HTML file you send to someone, and anything you open from your own disk, draws every layer and every feature. The attribution badge stays - the exemption lifts limits, never the credit.
They apply when the map is served from a real domain: a Folder or Share ZIP export published to a web server. A paid licence lifts them there too.
Uncapped is not the same as licensed. Whether you may use an exported map commercially is a licensing question, unaffected by which limits happen to apply - see Using a paid OnlyMap licence.
On a hosted map the two feature limits behave differently, and the second is the dangerous one.
- Past 5 layers, the extra layers render nothing. An obviously missing layer is at least obvious.
- Past 25,000 features, the layer is truncated, not dropped. The runtime draws the first 25,000 features in source order and discards the rest. It shows the recipient a dismissible on-map notice naming the layer and the counts (“Showing 25,000 of 500,000 rows…”), so the shortfall is not hidden. But the legend, any filter widgets and the map’s own statistics describe only the part that was drawn - so once the notice is dismissed, the map reads as complete while being a subset.
The plugin will not let this happen quietly:
- The Fidelity tab names every layer that is over a limit, before you export, and says how many features are missing. It flags them for any export, since it cannot know whether you will later host the file.
The Fidelity tab is now the only place this is reported. Exporting used to push a warning into the QGIS message bar and mount the runtime’s error panel in the exported map as well; both were removed, because on a local map there is nothing to warn about - the runtime validated those exports, found nothing wrong, and showed a success badge over the legend for its trouble. If you publish to a web server, check the Fidelity tab first.
To stay within the limits on a hosted map without a licence: tick Export only the features in this view on the Map tab, which leaves out everything outside the current QGIS view and is the quickest way to bring a very large layer under the feature cap; split the project across several maps; or filter the layer in QGIS.
Clipping reports what it removed, per layer, in the Fidelity tab - features that are not there leave no gap on the map, so this is the one thing an export cannot show you for itself.
Using a paid OnlyMap licence
A key lifts the limits on a hosted map and removes the on-map badge. A map opened locally is already uncapped, so a key changes nothing there - but see the note on commercial use below, which is a separate question from what the runtime enforces.
Because that leaves a key mattering only for hosted maps, the export dialog has no field for one. Supply it either way round instead:
- set the
ONLYMAP_LICENSE_KEYenvironment variable, which is also the only route that works on a machine with no QGIS profile - a server, a container, CI; - or pass the OnlyMap licence key parameter to the Export project to OnlyMap Processing algorithm.
Both are picked up by the dialog too, so a key set once applies to every export.
The key is stored on your computer, not in the .qgz, so it follows you between
projects and is never sent to anyone you share a project file with. It is written
into each map you export with it - that is how the runtime reads it, and it is
safe: the key is signed and domain-locked rather than secret.
A key is tied to the domains it was issued for. The runtime checks the key against the domain the map is served from, and a Standalone HTML file opened by double-clicking has no domain at all - so a key issued for your organisation’s domain does not apply to it, and the map runs on the free plan. That no longer costs you anything in size: a local map is uncapped either way. It is why the badge can still appear on a file you emailed.
So a paid licence earns its keep when you host the map (Folder or Share ZIP, published to a web server on a domain the key covers).
Commercial use is a separate question from the limits. OnlyMap’s licence is explicit that technical limits are a convenience, not the grant: their “presence, absence, or failure” changes nothing about what you are allowed to do, and commercial use - including distributing the map inside a packaged or installable application - requires a commercial key regardless. A Standalone HTML export for paid or commercial work therefore needs a licence even though nothing in it will be capped or refuse to draw. Nothing in this plugin checks that and nothing will; take the question to onlymap.nikaplanet.com rather than to us.
The Map tab reads your key and says which domains it covers and whether it has expired.
Batch and model exports use the same key. The Processing algorithm takes an
optional OnlyMap licence key parameter; leave it blank and it falls back to the
ONLYMAP_LICENSE_KEY environment variable, then to the key saved in the dialog.
The environment variable is the route that works on a machine with no QGIS
profile - a server, a container, or CI.
Symbology
| Single symbol | Yes |
| Categorized | Yes, with a category legend |
| Graduated | Yes, keeping your exact class breaks |
| Per-class symbol size, line width and outline colour | Yes, each class keeps its own |
| Line cap and join style | Yes, where you chose rounded |
| Marker shapes (square, star, triangle, …) | Yes - drawn by QGIS itself |
| SVG markers, including parametrised fill and stroke | Yes - drawn by QGIS itself |
| Stacked symbol layers on a point | Yes - drawn by QGIS itself |
| Stacked symbol layers on a line or polygon | Top layer only - the one you see - and reported |
| Rule-based, embedded-symbol renderers | Not yet, reported by name |
| Dashed and dotted lines | Yes - the line style dropdown and custom dash patterns alike |
| Markers along a line, or filling a polygon | Not yet, reported |
| 2.5D renderer | Yes - becomes a real extrusion, keeping the roof and wall colours |
Markers
A point layer using anything a plain circle cannot express — an SVG file, one of QGIS’s ~40 marker shapes, or several symbol layers stacked into one marker — is drawn by QGIS into the exported file as a small image sheet, and the map draws from that. Nothing about the symbol is re-created in the browser, so a parametrised SVG comes out in the colours you set it to, and a stacked marker comes out stacked.
This is the single biggest gap in the incumbent: qgis2web draws every marker as a circle, in both of its renderers, and says nothing about it (qgis2web#1218).
Worth knowing:
- It applies to the whole layer. If one class uses an SVG, every class in that layer is drawn the same way, plain dots included. Splitting one layer in two would make the halves fight over which draws on top.
- The legend switches with it. A map with drawn markers gets a legend whose swatches are those same markers, so the legend and the map cannot disagree. That legend is static, so it does not grey a layer out when you hide it from the layer switcher; every other map keeps the interactive legend.
- Marker size, rotation and offset are kept. A layer whose classes differ in size keeps each class’s own size.
- Very elaborate layers fall back. Past 256 distinct marker appearances in one layer, or markers so large the sheet would exceed what some graphics hardware accepts, the layer draws as plain circles in its own colours rather than drawing some markers and not others. The Fidelity tab says which, and why.
- If you host the map behind a strict Content Security Policy, it needs to
allow
data:images — see Hosting.
Height
Polygons that stand up in QGIS stand up in the export. Both of the places QGIS keeps a height are read:
- Layer Properties → 3D View, where an extrusion height can be a fixed number or driven by a field, and Show edges becomes a wireframe outline.
- The 2.5D renderer on the Symbology tab, whose height is kept as a project variable.
A map with anything raised on it opens tilted, because looking straight down at an extruded map and a flat one gives the same picture.
What does not carry: a base height, because the web renderer extrudes from ground level; a height written as a QGIS expression rather than a single field or a number; and the 2.5D renderer’s fixed viewing angle and painted shadows, which are replaced by real lighting. 3D point symbols - spheres, cylinders, imported models - are not drawn at all, and lines cannot be raised. Every one of these is named in the Fidelity tab rather than left to be discovered.
Terrain
Relief is off by default and, unlike everything else here, it is not read from your project. A QGIS terrain is a DEM on your disk, and a web map needs elevation tiles it can fetch, so there is no route from one to the other short of hosting your DEM yourself.
What the Map tab offers instead is global relief, streamed from a public elevation tileset. The trade is the same as a basemap’s: the file does not get any bigger, but the map needs a connection to show relief. Switching it on also tilts the map, for the same reason extrusion does.
The relief carries your basemap. With both a basemap and relief chosen, the basemap’s imagery drapes over the terrain surface, so the mountains look like the map rather than a plain grey model — and your own symbology drapes over them, painted onto the slopes. Extruded layers drape flat too - their colour paints the mountains, but column height does not show while relief is on, and the Fidelity tab says so. Two caveats: Liberty and Bright are vector-only styles with no raster imagery to drape, so with those the relief stays grey (the Fidelity tab says so); and Positron’s draped imagery comes from carto.com even though its flat tiles come from openfreemap.org — relief adds that third party, and the Fidelity tab names every host involved.
Labels are unreadable over relief. The map library stops honouring their text size once relief is on, so the words shrink to a few pixels and squash while the layer’s own markers keep their size — the text is there, and too small to read at any size you set. The Fidelity tab names the affected layers. Turn relief off if the labels matter more than the terrain.
Polygon outlines do not draw over relief either — the fills paint the surface but their borders disappear, so overlapping translucent areas are hard to tell apart. The Fidelity tab names the affected layers. Turn relief off if the outlines matter more.
Relief detail ends at roughly a 1:2.5 km scale: the public elevation tiles stop there, and past it the terrain would blank rather than magnify. A relief export therefore stops the camera at that scale — zooming further glides back to the closest view that still renders. Maps whose story needs street-level zoom should leave relief off.
If your project has its own terrain and you leave this off, the Fidelity tab says so rather than exporting a flat map silently.
Labels
Text, font, colour, halo and background are translated, along with the placement quadrant, offset and rotation you set in QGIS.
Text case (uppercase, lowercase, capitalise, title case) and line breaking — both the wrap character you set and automatic wrapping at a character count — are applied to the label text itself, because that is what QGIS does too.
Collision handling, callouts and curved placement are not: the web map draws every label, so where a layer’s labels would pile up they wait for a closer zoom - the one at which most of them have room - and the Fidelity tab names it. Italic is dropped, because the web renderer builds its font from a family and a weight only; that is reported.
Dense point layers cluster. A point layer of 100 or more points that would overlap when zoomed out merges them into count bubbles, which split as you zoom in; clicking one zooms to its points. A bubble’s size follows the log of how many points it holds, so a bubble of 5,000 is a step bigger than one of 500 rather than swallowing the map. Its labels appear once separate places have stopped merging, and its popups open on points, not bubbles. Points at exactly the same spot stay one bubble showing how many there are. The Fidelity tab gives the zoom at which the points show one by one. Untick Cluster dense points on the layer’s Points row in the Layers tab to show every point instead.
Names beside every point. On a point layer’s Points row, Names picks a field whose value shows beside each point with a halo, without clicking for a popup. It replaces the layer’s QGIS labels, and like them the names appear from the zoom where most have room.
Labels using an expression rather than a single field are not translated yet.
Labels can be turned off per layer on the Layers tab.
Popups
Field names, aliases, and fields you hid in the QGIS attribute table are all respected. Popups are labelled by default, and can be turned off per layer.
A field whose name contains anything besides unaccented letters, digits and
underscores (a space, a parenthesis, an accented letter) cannot be referenced
by the web popup template, so it is renamed in the exported data —
Last Known Eruption becomes Last_Known_Eruption, Höhe becomes H_he —
while the popup label keeps the original spelling. The Fidelity tab lists
every rename. The one exception is a field the map draws with (a category
field, a label field, an extrusion height): renaming it would break the map,
so its popup entry shows the raw placeholder instead and the Fidelity tab
says so — rename the column in QGIS if that popup matters.
Expand a layer on the Layers tab to set how each of its fields appears:
| Setting | What the popup shows |
|---|---|
| Value only, no label | The value on its own. |
| Label beside value — always show | Name and value on one line, even when the value is empty. |
| Label beside value — only if it has data | The same, but the row disappears for features with no value. This is the default. |
| Label above value — always show | Name on its own line, value beneath it. |
| Label above value — only if it has data | The same, but the row disappears for features with no value. |
| Do not show this field | The field is left out entirely. |
Fields hidden in the QGIS attribute table start on Do not show this field; choosing anything else overrides that.
Set every field to below the layer list applies one setting to every field of every layer at once, replacing the individual choices.
Settings for one layer only
Expanding a layer also reveals a This layer only row, where three map-wide settings can be overridden for that layer alone:
- whether its popups open on hover or on click,
- its highlight colour,
- its coordinate precision — including keeping full precision for one layer while the rest of the map is rounded.
A point layer also has a Points row: Names shows a field’s value beside every point, with a halo, and Cluster dense points (on by default) can be unticked to show every point rather than count bubbles.
Each starts on “same as map”, so a layer you never touch follows the map-wide choice. This is deliberately something qgis2web has never offered: the same three settings have been requested there as per-layer options since 2015 (#131, #132, #133) and remain global-only. Without it, “every layer alike except one” means configuring every layer.
The “only if it has data” settings are resolved in the browser as the map is used, because whether a value is empty depends on the feature you clicked. On browsers older than about 2023 those rows show empty instead of disappearing; everything else is unaffected.
Attribution
A credit set on a layer — in Layer Properties → QGIS Server → Attribution, or as metadata rights — is shown in the map’s credit component, in the bottom-right corner. Credits from several layers are combined, and duplicates appear once.
They sit outside the collapsing part of that component, so they stay visible on a phone: attribution hidden behind a click does not discharge a licence obligation.
If a layer carries no credit, no credit line appears. The plugin cannot invent one, so if your source requires attribution, set it in QGIS before exporting.
The map itself
Legend, layer switcher, zoom controls and a scale bar are on by default. The layer switcher is left out of maps that have only one layer to switch, since it would hold a single ticked box; labels count as an entry of their own, so a labelled layer is enough to bring it back.
On the Appearance tab you can also:
- Show the map name and the project description over the map, in a corner of your choosing. The description is the abstract from Project Properties → Metadata; nothing appears if the project has none. Corners are shared with the map controls — the layer switcher is top left, the legend top right, the zoom and scale bottom left, and the OnlyMap credit bottom right.
- Set the colour of the controls, background and text separately. Left alone, they use OnlyMap’s own colours.
- Open popups on hover instead of on click. Hover replaces click rather than adding to it: with both, clicking an already-open popup appears to do nothing.
- Set the highlight colour shown when the cursor is over a feature. Keep some transparency — a solid colour hides whatever the feature sits on top of. qgis2web has no control for this at all: it reuses the QGIS editing selection colour, opaque yellow by default, and the only way to change it is Project Properties, outside the plugin entirely.
Each of the last two, plus coordinate precision, can also be set for a single layer — see Settings for one layer only above.
The starting view comes from your data’s extent. Data crossing the 180th meridian - Alaska, Fiji, Chukotka - is handled correctly rather than opening zoomed out to the whole world.
On the Map tab you can open the map on the current QGIS view instead. That is a plain rectangle, so a view spanning the 180th meridian falls back to the data extent, which handles the wrap properly.
Coordinate precision is on the same tab. Full precision is kept unless you choose otherwise; rounding makes the file smaller and is the one setting here that throws data away, so it is listed in the fidelity report whenever it is set. Roughly, six decimal places is 0.1 m at the equator.
Basemaps
There is no basemap by default, and that is what lets an exported map work with no internet connection at all.
You can choose one on the Map tab - OpenStreetMap, Positron, Dark Matter, Voyager, Liberty or Bright. It is worth understanding what that changes, because it is the only setting whose cost falls on whoever you send the map to:
- The file does not get any bigger. Tiles are fetched as the map is used, not packed into the export.
- The map stops working offline. Without a connection the data still draws, but the background does not.
- Each recipient’s browser contacts the tile provider directly every time they open the map.
Tiles cannot be bundled for offline use. Beyond the size - the Alaska region alone is several gigabytes at usable zoom levels - the OpenStreetMap tile usage policy prohibits bulk downloading and offline use of its tiles.
The Fidelity tab names the provider you are depending on whenever a basemap is set.